
Interpreting Data: Examples from Tables and Charts

Interpretation of the table or the pie chart or bar diagram based on this
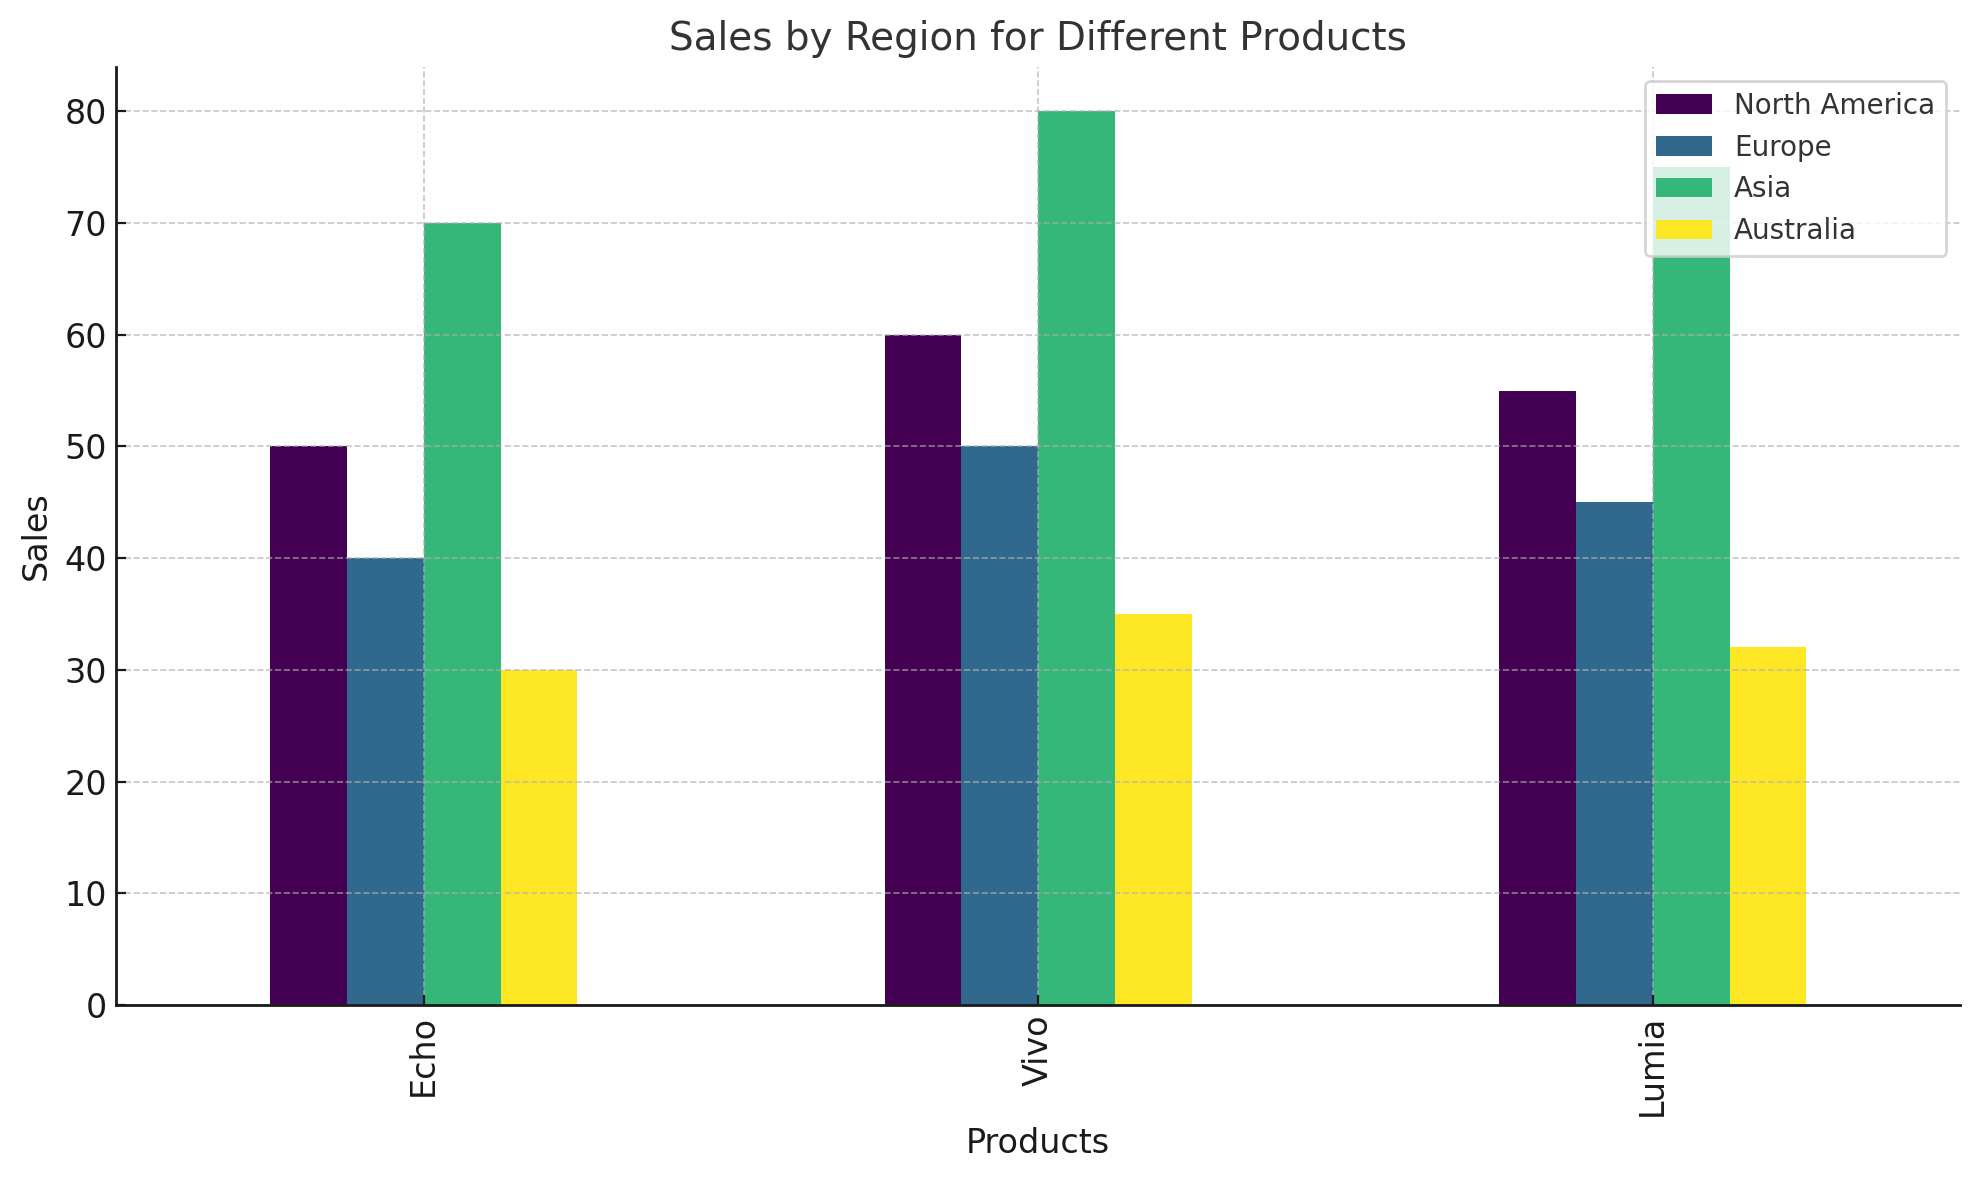
| Product | North America | Europe | Asia | Australia |
|---|---|---|---|---|
| Echo | 50 | 40 | 70 | 30 |
| Vivo | 60 | 50 | 80 | 35 |
| Lumia | 55 | 45 | 75 | 32 |
Interpretation 1
The table illustrates the sales revenue (in million dollars) generated by three smartphone brands—Echo, Vivo, and Lumia—across four regions: North America, Europe, Asia, and Australia.
Overall, Asia emerges as the most lucrative market, while Australia records the lowest sales figures. Among the three brands, Vivo consistently leads in all regions, whereas Echo generates the least revenue in every market.
Asia contributes the highest revenue for all brands, with Vivo achieving the peak sales figure of $80 million, followed by Lumia at $75 million and Echo at $70 million. North America ranks second, with sales figures trailing 20 million dollars behind those in Asia across all brands. Europe follows closely, generating revenues 5 to 10 million dollars lower than North America.
In contrast, Australia is the weakest market, where sales figures are notably lower across all brands. The revenue difference between brands is minimal in this region, ranging only from $30 million (Echo) to $35 million (Vivo), making it the market with the narrowest sales gap. Meanwhile, the largest revenue disparity is seen in Asia, where Vivo outperforms Echo by a significant $10 million.
In summary, the data highlights Asia as the dominant revenue source for all three brands, while Australia remains the least profitable market with the smallest variation in sales figures.
Interpretation 2
The table delineates the sales revenue, in millions of dollars, for Echo, Vivo, and Lumia smartphones across four regions: North America, Europe, Asia, and Australia. Overall, Asia constitutes the most lucrative market, while Australia exhibits the lowest sales. Vivo consistently yields the highest revenue across all regions, conversely, Echo the least.
Asia demonstrates the most substantial figures, with Vivo reaching $80 million. North America trails by approximately $20 million, and Europe by a marginal $5 to $10 million. Conversely, Australia presents the least robust market, with minimal revenue differentials between brands, ranging from $30 million (Echo) to $35 million (Vivo). The most pronounced revenue disparity occurs in Asia, where Vivo outstrips Echo by $10 million.
In summation, Asia emerges as the predominant revenue source, while Australia is the least profitable, with the narrowest sales variance. Total sales: Vivo $225 million, Lumia $207 million, Echo $190 million.
To learn more about the choice of words in describing data, read this article